
Win Rate, Risk-Reward and Expectancy: The Casino Math
A 40% win rate can beat a 70% one — and once you see the math you can never unsee it. Expectancy, breakeven win rates, and why one glorious week proves absolutely nothing.
📘 Two traders, one surprise
Meet two traders after 100 trades, both risking $10 per trade.
Tina wins 70% of the time. Her winners make $5; her losers cost $10.
Ben wins only 40% of the time. His winners make $25; his losers cost $10.
Who is rich? Run the numbers — really run them, this is the lesson:
Tina: 70 wins × $5 = +$350. 30 losses × $10 = −$300. Net: +$50. Barely surviving — one bad stretch from zero.
Ben: 40 wins × $25 = +$1,000. 60 losses × $10 = −$600. Net: +$400. Eight times Tina's profit — while being "wrong" most of the time.
Ben loses more often than he wins and beats Tina by a mile. If that feels wrong, good: that feeling is the beginner intuition this lesson replaces. Win rate is not the score. Expectancy is the score.
🎯 What you will learn
The expectancy formula and how to compute it from a trade log.
Breakeven win rates for every common risk-reward ratio.
Why sample size decides what your results mean.
The casino mindset — the mental model professionals actually use.
🧮 Expectancy: profit per trade, on average
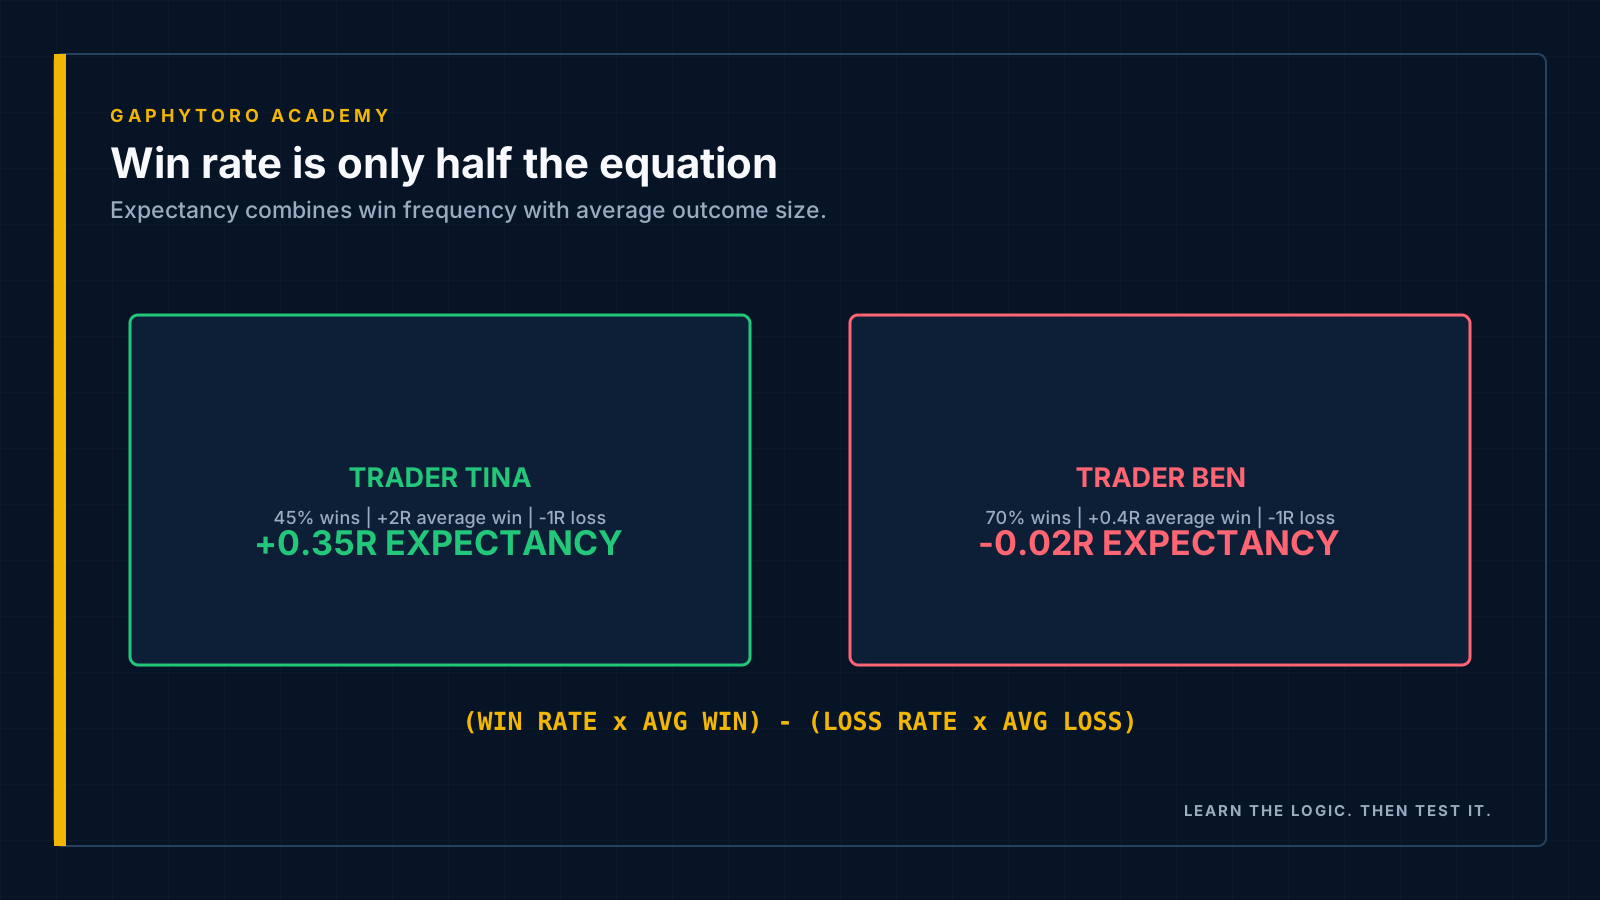
Expectancy answers one question: on average, what does one trade of this strategy earn me?
Expectancy = (Win rate × Average win) − (Loss rate × Average loss)
Ben: (0.40 × $25) − (0.60 × $10) = $10 − $6 = +$4 per trade. Every trade Ben places is, statistically, a $4 note — even the losers, because losers are simply the tuition inside a profitable process. Tina: (0.70 × $5) − (0.30 × $10) = $3.50 − $3.00 = +$0.50. Positive, but one spread-widening or one moved stop from negative.
Expectancy is usually quoted in R-multiples (profit measured in units of risk): Ben's is +0.4R per trade. Positive expectancy in R is the only proof a strategy deserves real money — and it is computed from a trade log, not from feelings. Your analytics dashboard calculates it continuously once your trades are journaled, alongside its cousin profit factor.
⚖️ The breakeven see-saw
Win rate and risk-reward trade against each other. For each reward size (in R), here is the win rate that merely breaks even:
| Average reward | Breakeven win rate | Meaning |
|---|---|---|
| 1R (risk $10 to make $10) | 50% | Must win half just to tread water |
| 1.5R | 40% | Lose 6 of 10 and survive |
| 2R | 33% | Lose 2 of 3 and survive |
| 3R | 25% | Right once in four is enough |
(Formula, if you like owning your tools: breakeven win rate = 1 ÷ (1 + R). And remember costs: spread and slippage shave every trade, so real strategies need a margin above breakeven, not equality with it.)
This table explains entire trading styles. Trend-followers happily lose 60% of trades hunting 3R runners. Scalpers hunting high win rates accept tiny rewards and live or die on costs. Neither is "right" — they are different seats at the same math table. What is wrong is the beginner default: high loss rate and small winners, the bottom-left corner where nothing survives.
🎲 Sample size: why one week proves nothing
Flip a fair coin ten times and getting seven heads is unremarkable. Flip it a thousand times and 70% heads means the coin is rigged. Trades are flips: small samples lie.
One glorious week ≈ 10–15 trades: noise. Ben has losing months inside his +0.4R strategy.
Judgement threshold: 30 trades minimum for a first read; 100+ before the numbers deserve trust.
Corollary in both directions: do not crown a strategy after a hot week — and do not execute one cleanly for eight trades, hit a normal losing streak, and bin it. That second mistake quietly kills more decent strategies than the market ever does.
The win rate your strategy "has" is not what it did this week. It is what it does over hundreds of logged trades. Until the log exists, you are guessing.
🎰 The casino mindset
A casino does not know whether the next spin wins or loses, and does not care. It knows the edge per spin and it knows volume will express that edge. It never doubles the roulette limits because the last hour went badly; it never panics on a millionaire's lucky night.
A trader with positive expectancy, fixed risk and a large sample is the casino. A trader judging themselves trade-by-trade — euphoric on wins, crushed by losses, resizing on emotion — is the gambler at the table. Same market, same charts; the difference is entirely which side of the math you choose to sit on.
Your journal is what makes the casino seat possible: it is the ledger where win rate, average win, average loss and expectancy stop being impressions and become numbers.
✅ Key takeaways
Expectancy = (win rate × avg win) − (loss rate × avg loss); positive-in-R is the only real scoreboard.
Breakeven win rate = 1 ÷ (1 + R): bigger rewards buy tolerance for being wrong.
A 40% win rate with 2.5R winners crushes a 70% win rate with 0.5R winners.
30 trades minimum to glance, 100+ to judge — hot weeks and cold streaks are both noise.
Think like the casino: edge per trade × volume, feelings not invited.
⏭️ Coming up next
Theory complete. Next module you step onto the practice floor: a structured demo-trading challenge where discipline — not profit — is the grade.