
Risk Management: The Mathematics of Survival
The most important lesson in this course. Percentage risk, the position-sizing formula, risk-reward ratios, drawdown mathematics and loss limits — the complete survival system, with numbers you can copy.
📘 The only lesson that is not optional
Here is an uncomfortable truth: you can skip the candlestick lesson and still make it as a trader. Skip this one and you are finished before you start — it is only a question of when.
Trading is not a game of being right. It is a game of surviving being wrong — because you will be wrong, regularly, forever. The best traders alive lose constantly. They remain rich for one reason: their losses are engineered to be small, and their wins are engineered to outweigh them.
That engineering is risk management. It is arithmetic, not artistry, and by the end of this lesson you will own the complete toolkit.
🎯 What you will learn
The percentage-risk rule and the brutal math of drawdowns.
The position-sizing formula — the most valuable equation in trading.
Risk-reward ratios and where stops actually belong.
Loss limits, losing streaks and hidden correlation risk.
💯 Rule one: risk a fixed small percentage
Professionals risk a small, fixed fraction of their account on every trade — commonly 1%, at most 2%. On a $1,000 account, 1% risk means a trade that costs $10 if the stop-loss is hit. Not $10 of margin, not $10 of position — $10 of maximum loss.
Why so small? Two reasons, both mathematical.
Reason one: losing streaks are normal
Even a coin-flip-fair strategy will hand you five, six, eight losses in a row eventually — not possibly, certainly. At 1% risk, an eight-loss streak costs about 8% of the account: painful, recoverable, survivable. At 10% risk, the same ordinary streak destroys more than half your capital — and your judgement with it.
Reason two: drawdowns punish asymmetrically
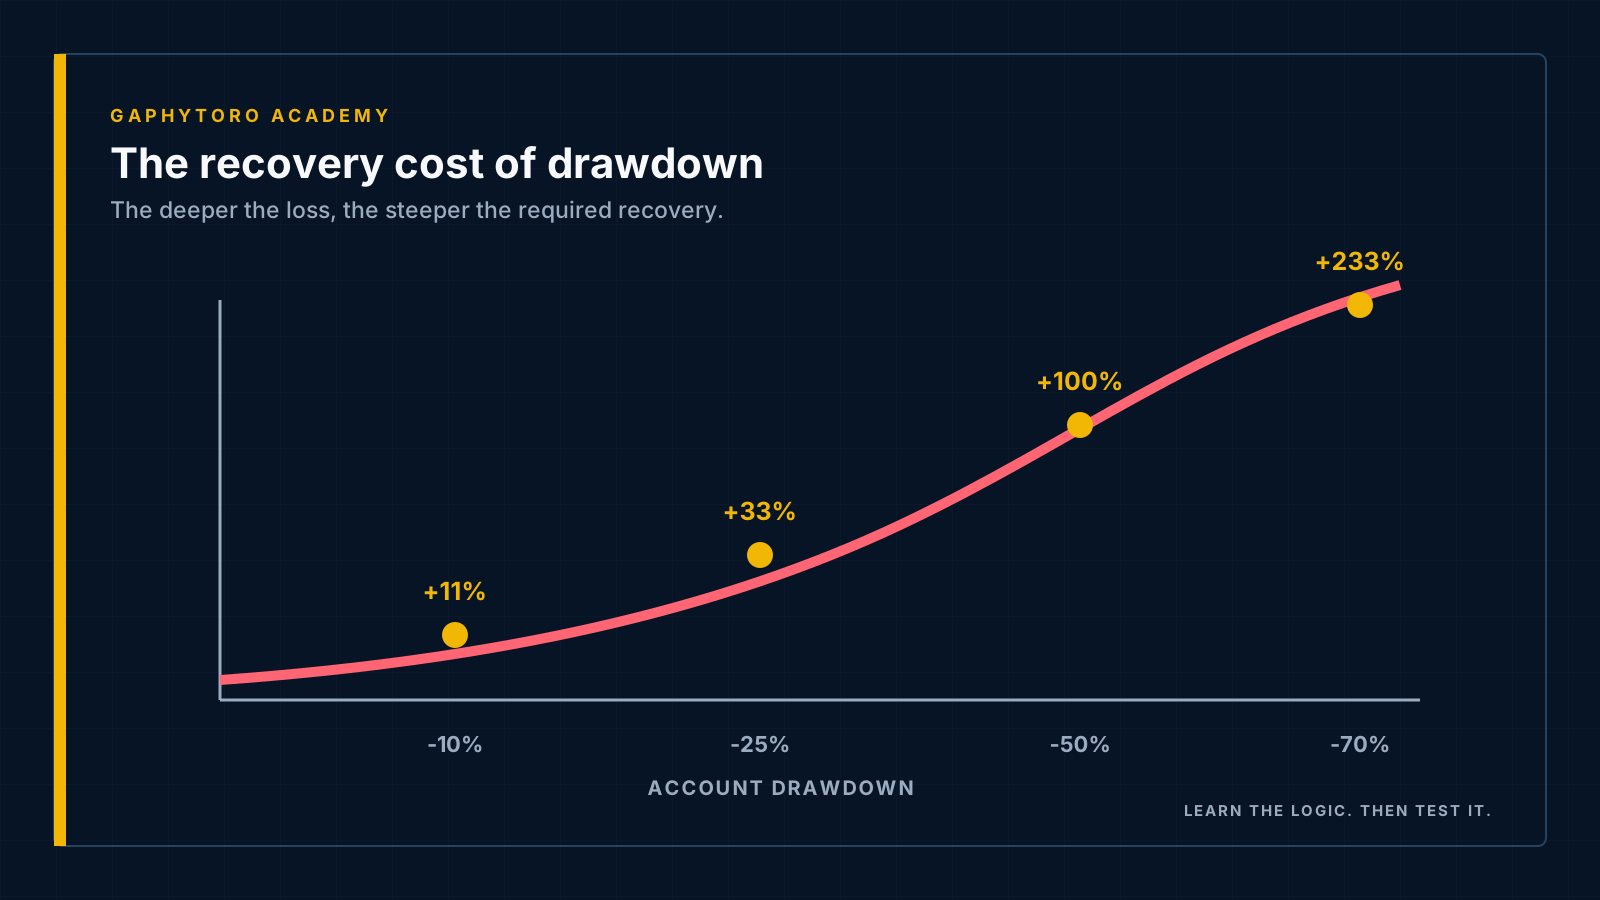
| Account loss | Gain required to recover |
|---|---|
| 10% | 11% |
| 25% | 33% |
| 50% | 100% |
| 75% | 300% |
Lose half your account and you must double what remains just to break even. The hole deepens faster than the climb out. Small risk per trade keeps you off the steep part of this curve forever — that is the entire secret. Your drawdown chart and equity curve will make this math personal once you start logging.
🧮 The formula that runs everything
Now connect the dots from the pip lesson. You know your account, your risk percentage, and your stop distance. Position size is not a feeling — it is the output of a formula:
Position size = (Account × Risk %) ÷ (Stop distance in pips × Pip value per lot)
Worked example
Account: $1,000. Risk: 1% → $10.
Setup: buy EUR/USD, stop-loss 25 pips below entry.
Pip value: $10 per pip per standard lot.
Size = $10 ÷ (25 × $10) = 0.04 lots.
Four micro lots. If the stop is hit: 25 pips × $0.40 = $10. Exactly 1%. The trade can now go completely wrong and tomorrow you trade again, unbruised.
Notice the profound consequence: the stop distance comes from the chart; the size comes from the math. A wider stop means a smaller position, not a bigger loss. Traders who size first and place stops second have it exactly backwards — and the market charges tuition for that error until the lesson lands. This formula is the heart of position sizing, and it should run before every single trade you ever place.
⚖️ Risk-reward: getting paid for the risk
Risking $10 to make $10 means you must win more than half your trades just to beat costs. Risking $10 to make $20 — a 1:2 risk-reward ratio — changes the arithmetic completely: you can lose six trades in ten and still grow.
Two placement rules keep the ratio honest:
Stops go where the idea dies — beyond the structure that made you take the trade (below the support you bought, past the swing that defined the setup), with ATR sanity-checking the distance. Never at a round number of pips because it "felt tight enough".
Targets go where price can plausibly reach — the next meaningful level, not a fantasy. If the honest target does not offer at least 1:1.5, the correct trade is no trade.
🧯 The circuit breakers
Individual-trade risk is not enough; you also cap the damage any single day or week can do:
Daily stop: −3% (three full losses) → close the platform. A bad day must never become a catastrophic one. The trades you place after three losses are rarely your best work — the psychology module explains exactly why.
Weekly stop: −6% → flat until Monday. Review your journal instead; the market will still be there.
Correlation check: long EUR/USD, long GBP/USD and short USD/CHF look like three trades — but all three are one bet: "dollar down". If the dollar rallies, you take three losses at once. Count exposure per currency, not per ticket, and treat correlated positions as one risk unit sharing one risk budget.
📓 Making it stick
Every rule in this lesson fails at the moment of temptation unless it is written down and audited. Record planned risk, actual risk and R-multiple on every trade. Then let your journal prosecute the gap: the GaphyToro journal computes your real risk per trade from the fills — and traders are routinely shocked by the difference between the risk they intend and the risk they take. Closing that gap is, for most people, worth more than any new strategy.
✅ Key takeaways
Risk 1% (max 2%) per trade — streaks are certain and drawdown math is merciless.
Size = (Account × Risk%) ÷ (Stop pips × Pip value). Chart sets the stop; math sets the size.
Demand at least 1:1.5 honest risk-reward or skip the trade.
Daily −3% and weekly −6% circuit breakers protect you from your worst self.
Correlated trades are one bet — budget risk per currency, not per ticket.
⏭️ Coming up next
You now own the survival math. The next module explains why traders with perfect formulas still blow up: the six emotional saboteurs of trading psychology — and the systems that defeat them.