
Technical Analysis Basics: Structure Before Indicators
Trends, ranges, support, resistance and breakouts — the structural skeleton every chart hangs on. Plus your first three indicators, introduced the right way: as assistants to your analysis, never replacements for it.
📘 The skeleton under the skin
Charts look chaotic — a heartbeat monitor drawn by a caffeinated toddler. But under the noise, price tends to organise itself into a small set of repeating structures. Technical analysis begins as the study of those structures: where price has been, where it repeatedly stalled, and what that implies about where it might struggle or accelerate next.
Notice the word implies. Technical analysis deals in probabilities, never certainties. Anyone selling you certainty is selling something else.
🎯 What you will learn
Trends, ranges, and the swing structure that defines them.
Support and resistance — the market's memory.
Breakouts, false breakouts, and why beginners get trapped.
Three starter indicators with one-sentence job descriptions.
📈 Trends and ranges: the market's two moods
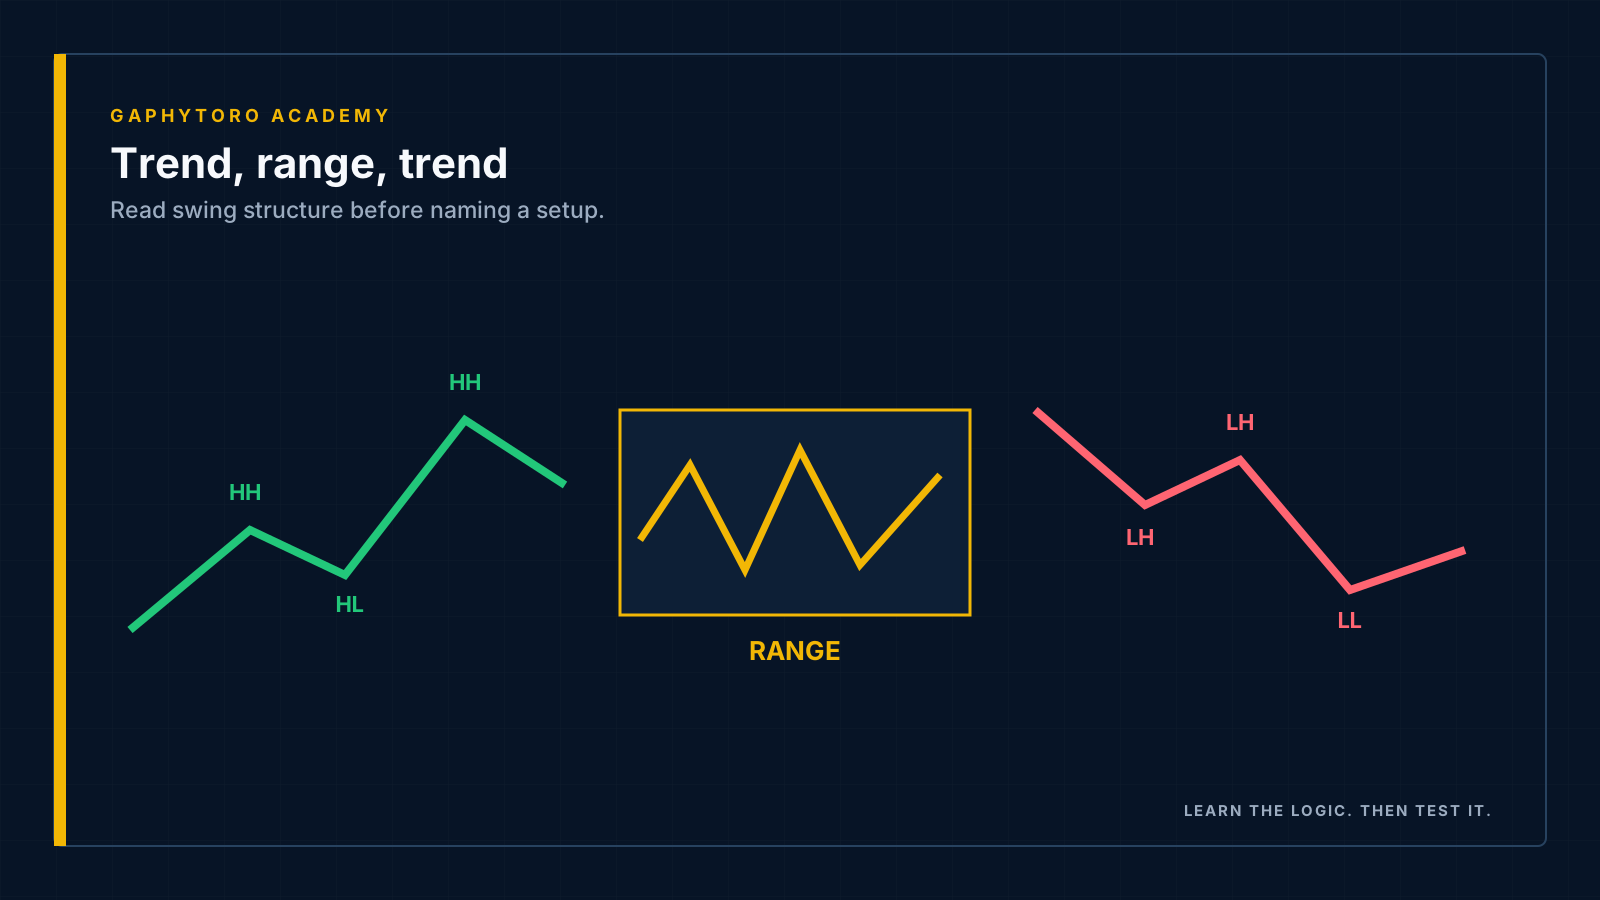
Zoom out on any chart and price is doing one of two things:
Trending
An uptrend is a staircase climbing: each push reaches a higher high, each rest stops at a higher low. Buyers are in charge; dips get bought.
A downtrend is the staircase inverted: lower highs, lower lows. Sellers rule; rallies get sold.
Those turning points — the tops of pushes and bottoms of rests — are called swing highs and swing lows. They are the joints of the skeleton. Mark them on any chart and the mood becomes obvious.
Ranging
Between trends, price often moves sideways — bouncing between a ceiling and a floor while the market makes up its mind. Ranges are not "broken trends"; they are the market breathing. Some of the best trades in this course's later lessons come from the moment a range ends.
First question for any chart, always: trending or ranging? Every tactic that works in one mood loses money in the other. Most beginner losses are mood-mismatch losses.
🧱 Support and resistance: the market's memory
Support is a price area where falling markets have repeatedly stopped falling — a floor where buyers historically showed up. Resistance is the mirror: a ceiling where rallies repeatedly died.
Why would history repeat? Because markets are made of humans (and algorithms trained on humans) with memory. Traders who missed the last bounce at 1.0820 want a second chance. Traders trapped at the last top want out at breakeven. Orders cluster where memory clusters — and price respects the cluster.
Three practical rules:
Zones, not lines. Support is a neighbourhood, not an address. Draw a band, not a laser line.
Touches build credibility; each test spends it. A level that held three times is meaningful — but every test consumes the orders defending it.
Roles reverse. Broken resistance often becomes support, and vice versa — the market's memory updating itself. This "role flip" will feature heavily in your strategy lessons.
💥 Breakouts and their evil twin
When price finally punches through a respected level and keeps going, that is a breakout — often the birth of a trend, as everyone repositions for the new reality.
But markets have a cruel sense of humour. Price frequently pokes through a level, triggers every breakout order… and snaps straight back. The false breakout — the market's most reliable beginner trap. One habit defangs it: wait for the close. A wick through a level proves price visited; a full candle closing beyond it proves price was accepted there. You will still occasionally be fooled — everyone is — but far less often, and your journal will tell you exactly how often, because you will be logging every one of these with their outcomes in your trading journal.
🔧 Your first three indicators
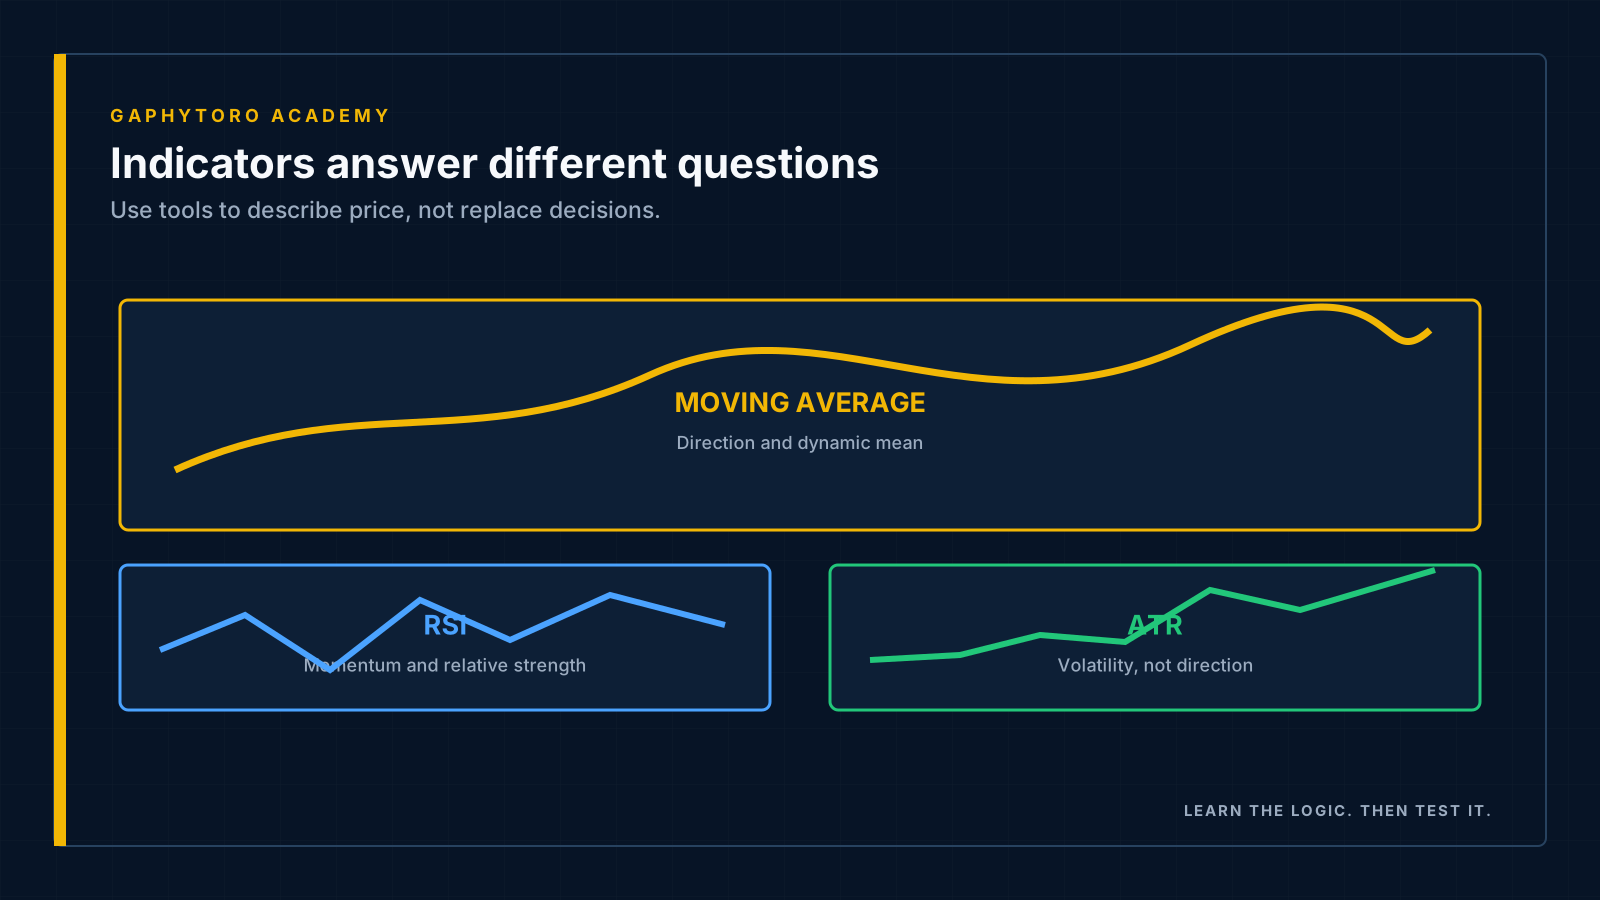
Now — and only now — we add tools. An indicator is a calculation drawn on the chart, and every one you use must pass the one-sentence job interview:
| Indicator | One-sentence job | Beginner use |
|---|---|---|
| Moving average (MA) | Smooths recent prices into one flowing line | A glance-check for trend direction and slope — price living above a rising MA = uptrend context |
| RSI | Scores the speed of recent gains vs losses from 0–100 | Spotting stretched conditions — extreme readings near strong levels deserve attention |
| ATR | Measures how far price typically moves per candle | Sizing stops sensibly — a stop tighter than the market's normal wiggle is a donation |
Notice what none of these jobs say: "tells me when to trade". Indicators describe; they do not decide. The moment an indicator becomes the reason for a trade rather than a supporting witness, the analysis has left the building. Structure first, indicators second — always.
✅ Key takeaways
Trending or ranging — answer it before anything else, every time.
Uptrend = higher highs + higher lows; downtrend = the inverse; swings are the skeleton's joints.
Support and resistance are zones of market memory; roles reverse when broken.
A close beyond a level beats a wick through it — the false-breakout vaccine.
Indicators describe, structure decides. MA for trend, RSI for stretch, ATR for stop distance.
⏭️ Coming up next
Charts show you what price is doing. The next lesson asks why: interest rates, inflation, jobs and the economic calendar — fundamental analysis, minus the PhD.